Tel: 0039 123 45 789 | Skype: info@domain.it

We're Coming Soon

We are working very hard on the new version of our site. It will bring a lot of new features. Stay tuned!


days

hours

minutes

seconds

Subscribe to our newsletter

Sign up now to our newsletter and you'll be one of the first to know when the site is ready:

Copyright © Aziza Damly | Powered by Blogger
Design by AZMIND | Blogger Theme by NewBloggerThemes.com

Sunday, September 2, 2018

Equities Forecast: DAX Eyes July Lows, Dow Jones Trend Remains Up

EQUITY ANALysis news

  • Dow Jones Industrial Average: Trend Remains Moderately Bullish
  • DAX: Bearish Sequence Brings July Lows in Focus

DOW JONES INDUSTRIAL AVERAGE: TREND REMAINS MODERATELY BULLISH

Another week of gains for the Dow Jones with the index now hovering around the 26,000 level. Eyes are on for a weekly close above 26,000, which will likely confirm that the uptrend in the index is still intact. Alongside this, the Dow Jones is still playing catch up relative to its US counterparts, which have hit record highs.
Support for the Dow Jones is seen at 25850, whereby the 76.4% Fibonacci retracement of the equity market correction seen in Q1 18. Consequently, the Dow Jones remains moderately bullish above 76.4% Fib level, despite the market jitters sparked by the increase in trade war tensions.

DOW JONES PRICE CHART: DAILY TIME FRAME (FEBRUARY-SEPTEMBER 2018)

Equities Forecast: DAX Eyes July Lows, Dow Jones Trend Remains Up

DAX: BEARISH SEQUENCE BRINGS JULY LOWS IN FOCUS

Equities Forecast: DAX Eyes July Lows, Dow Jones Trend Remains UpGains in the DAX petered out after rejecting the trendline from the June high, while resistance at 12643, which marks the 50% fib level from the 13184-12102 fall also held firm. Momentum indicators suggest that the bias is on the downside. Support at 12350 has curbed an extension to the recent losses for now, however, a firm break below could likely bring the July lows at 12100 back into focus.

DAX PRICE CHART: DAILY TIME FRAME (APRIL-SEPTEMBER 2018)

Equities Forecast: DAX Eyes July Lows, Dow Jones Trend Remains Up

Brazilian Real and Indian Rupee Stall Decline After GDP Figure Release

Talking Points:
  • Brazilian QoQ GDP was 0.2% versus an expected 0.1%, year-over-year GDP was 1.0%
  • India saw robust growth, posting 8.2% in the most recent quarter
  • The data releases provide some buoyancy for troubled emerging market currencies amid crisis concerns
After consecutive days of weakness for emerging markets, the world’s fifth and seventh largest economies by GDP looked to stall a broader decline with positive GDP data. Due to their size, the two countries carry significant weight in the emerging market basket and their growth will surely generate some positive sentiment to counteract the issues facing the basket as a whole.
Brazil GDP Delivers near Target
As for the specifics, Brazil’s Q2 quarter-over-quarter GDP read in at 0.2%. A rather low figure for global standards. According to the World Bank, global GDP was 3.1% in 2017. Still, Brazils 0.2% GDP growth surpassed the expected 0.1%. Year-over-year GDP came in below the expected 1.1% at 1.0%. South America’s largest nation has been beleaguered by a trucker strike and political concerns as a presidential election looms. Coupled with domestic concerns, regional developments like Venezuela’s hyperinflation also worked to weigh down the Brazilian economy. Following the data release, the Brazilian real saw a reprieve from recent troubles and gained ground versus the dollar.
USD/BRL Price Chart 10-Minute Time Frame, August 30th – 31st
Brazilian Real and Indian Rupee Stall Decline After GDP Figure Release
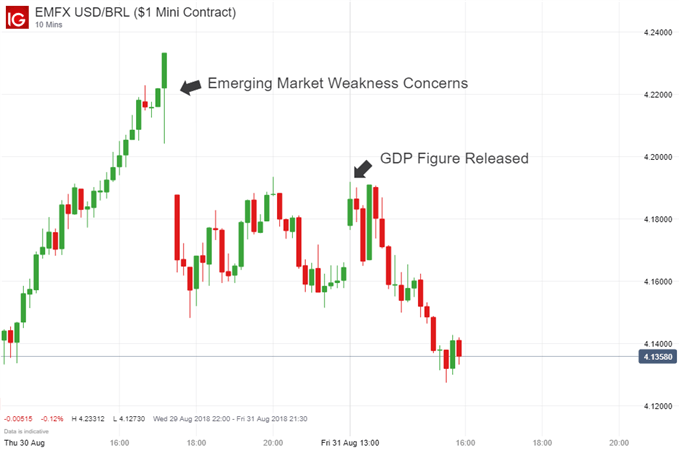
The real was up 0.73% versus the greenback, trading near 4.135 at the time of this article. The news is a welcome development that may help to temper losses by the real should emerging market concerns continue.
Indian GDP Surpasses All Expectations
Shattering global standards, Indian GDP read in at a staggering 8.2%. The figure marks the highest growth in two years, the strongest since the first quarter of 2016. The data also surpassed domestic expectations of 7.5% growth.
USD/INR Price Chart 10-Minute Time Frame, August 30th – 31st
Brazilian Real and Indian Rupee Stall Decline After GDP Figure Release
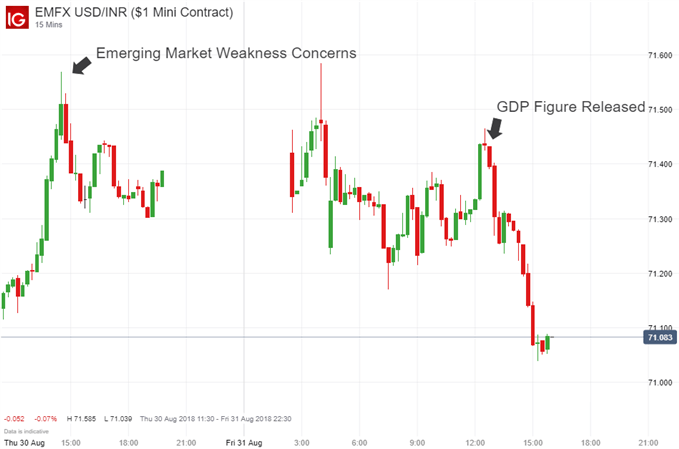
Again, the strong figure generated a brief rally in the rupee versus the dollar. Moving forward, market participants will take note of the strong GDP figure but it may not be enough to completely stop the rupee’s decline. Although the rupee traded around 71.085 at the time of this article, Friday morning saw the rupee trade at its lowest level versus the dollar ever near 71.600.
Strong GDP Unlikely to Stop Broader Emerging Market Decline
Although both Brazil and India delivered robust results, the issue emerging markets face is larger than data releases can counteract. Trade wars, sanctions, and other headwinds have battered emerging markets. The steep decline in currencies like the Argentine peso and the Turkish lira have spread weakness and concern to countries that were otherwise on strong footing. Collectively, the recent weakness is enough to drag down even the strongest emerging markets like India.
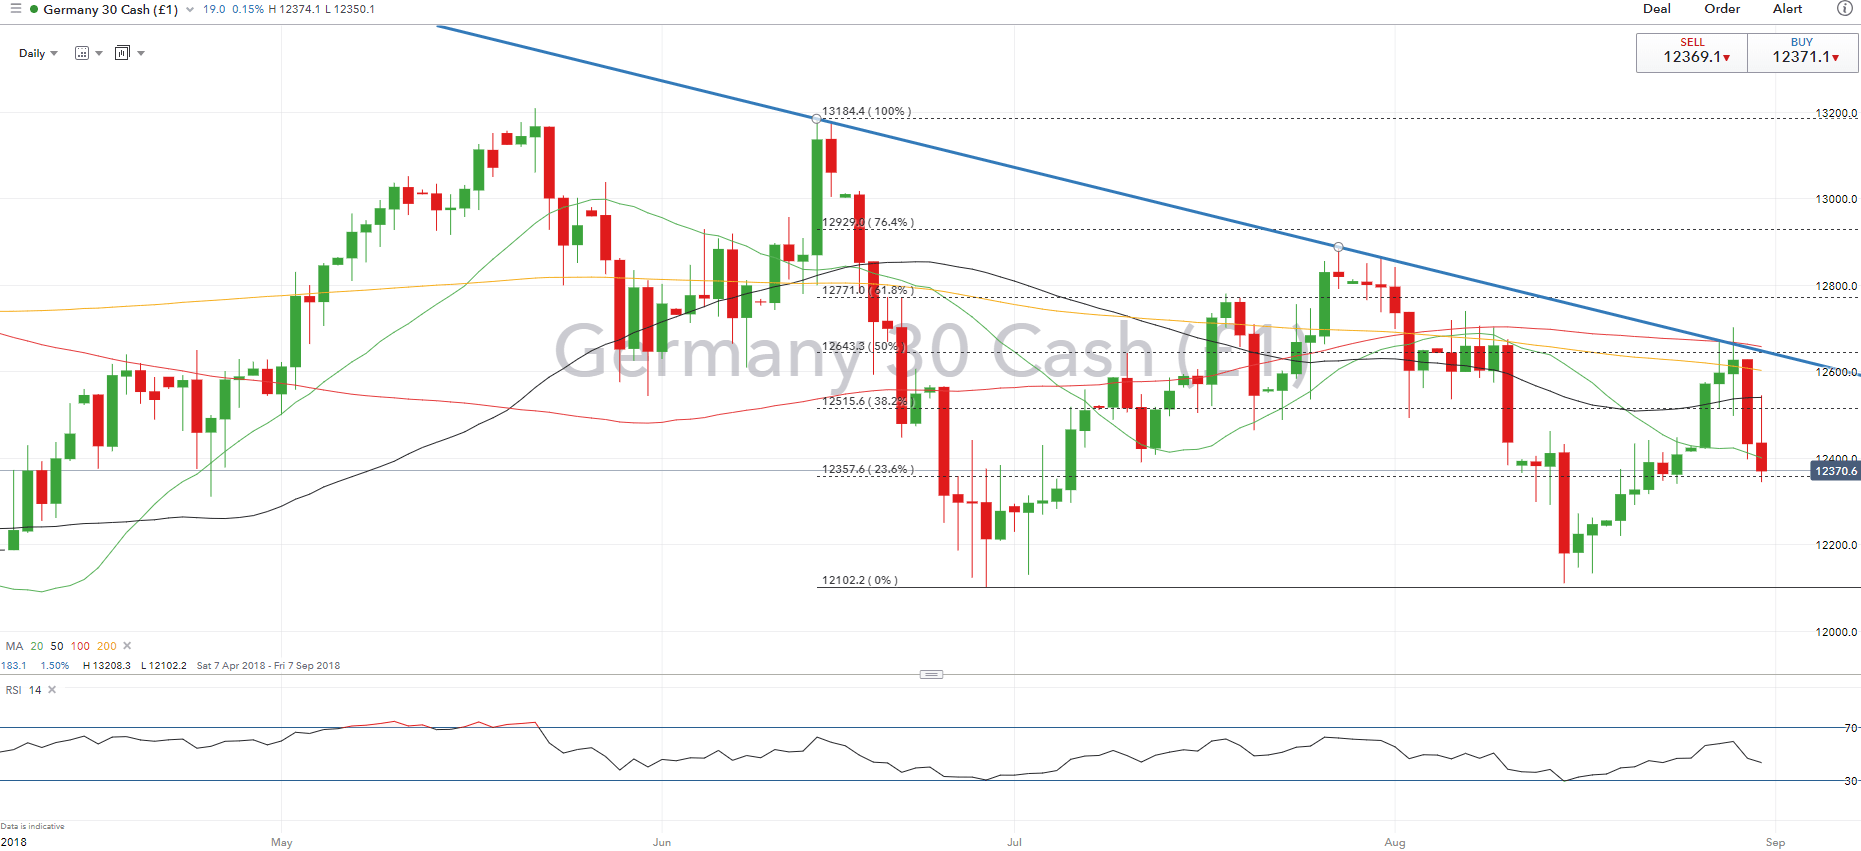
GBPUSD Weekly Technical Outlook: Building For The Next Leg Higher

GBPUSD TECHNICAL HIGHLIGHTS, PRICES AND ANALYSIS

  • Daily chart shows GBPUSD sitting in a one cent range.
  • Four-hour chart is sitting on a cluster of moving averages which may provide upward momentum.
  • Retail traders are long, and sentiment remains positive.
GBPUSD retook the 1.3000 ‘headline’ level and has now just faded lower but another, stronger, attempt to turn this into new support looks likely. The pair also sit near the top of 20- and 50-day cloud and need to clear this to push further ahead. The RSI indicator is at a multi-month high, although turning lower, and has plenty of room to push higher before it enters overbought territory. The top of the August 2 ‘bear candle’ at 1.31290 needs to be broken to confirm further strength.

GBPUSD DAILY PRICE CHART (JANUARY – AUGUST 31, 2018)

GBPUSD Weekly Technical Outlook: Building For The Next Leg Higher
A look at the four-hour GBPUSD chart also confirms the the pair stuck between 1.2957 and 1.3043 although the downside is being probed. Initial support should be provided by the cluster of moving averages currently between 1.2907 and 1.2963. The short-term uptrend from the August 15 low remains in place and coincides with the bottom of the moving average cluster. Support is likley between 1.2800 and 1.2850 if the lower moving average is broken and closed below.

GBPUSD FOUR-HOUR CHART (AUGUST 6 – AUGUST 31, 2018)

GBPUSD Weekly Technical Outlook: Building For The Next Leg Higher

GBPUSD Weekly Technical Outlook: Building For The Next Leg Higher

CAD Rate Forecast: Short Term CAD Outlook Dependent on NAFTA Outcome

Please add a description for the image.
Fundamental Forecast for CAD: Neutral

USDCAD ANALYSIS AND TALKING POINTS:

  • Short Term CAD Direction Dependent on NAFTA Outcome
  • Bank of Canada Governor Poloz to Emphasis Gradual Tightening

SHORT TERM CAD DIRECTION DEPENDENT ON NAFTA OUTCOME

Headline risk for the Canadian Dollar remains at elevated levels as Canada looks to reach a NAFTA agreement in principle with the US. As such, the near-term direction for the Loonie is very much dependent on the outcome from the latest NAFTA talks, with an agreement likely to support the Canadian Dollar, which would likely see USDCAD retest the recent lows at 1.29. The trend for USDCAD remains bearish provided the pair holds below 1.30 with 1.2850 eyed as the next significant target. Failure for Canada and the US to reach an agreement could see the pair breach the top of the bearish channel around 1.3110 to make a run in on 1.32.

BANK OF CANADA RATE DECISION

Market pricing for a rate hike at next week’s Bank of Canada rate decision are relatively low at 20%, which suggests that the BoC will hold off for now (most likely scenario of October rate hike). Alongside this, with Q2 GDP printed roughly in line with the BoC’s forecast at 2.9% (BoC exp. 2.8%) and Poloz highlighting at the Jackson Hole Symposium that the boost in inflation has been due to transitory factors, further suggests that the Governor will likely emphasise a gradual approach to raising rates.
CAD Rate Forecast: Short Term CAD Outlook Dependent on NAFTA Outcome
Canadian Employment Report
Another key risk event on the economic schedule for the Loonie will be the latest jobs report at the backend of the week. As a reminder, the prior employment report had shown a robust jobs gain of 54k, however, the components were slightly softer with the contribution coming from part time jobs. Consequently, given the risk events this week, USDCAD 1-week implied volatility are at lofty levels of around 120pip breakeven.
Next week’s Economic Calendar
CAD Rate Forecast: Short Term CAD Outlook Dependent on NAFTA Outcome
Source: DailyFX

USDCAD PRICE CHART: DAILY TIMEFRAME (JANUARY-AUGUST 2018)

CAD Rate Forecast: Short Term CAD Outlook Dependent on NAFTA Outcome

USDCAD TECHNICAL LEVELS

Resistance 1: 1.3115 (23.6% Fibonacci Retracement)
Resistance 2: 1.3180-1.32 (Resistance Area)
Support 1: 1.2940-50 (Support Area)
Support 2: 1.2900 (Weekly low)
Support 3: 1.2875 (200DMA)

Search This Blog

Powered by Blogger.

Blog Archive

Pages