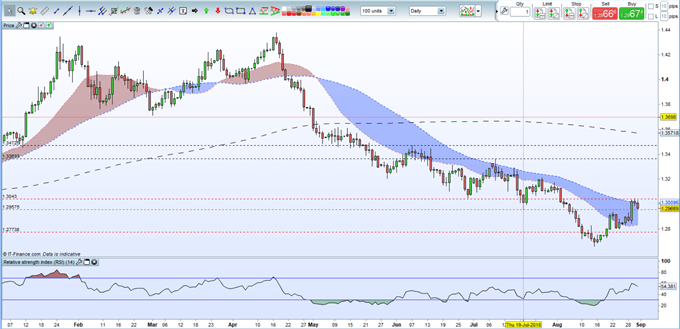
- Daily chart shows GBPUSD sitting in a one cent range.
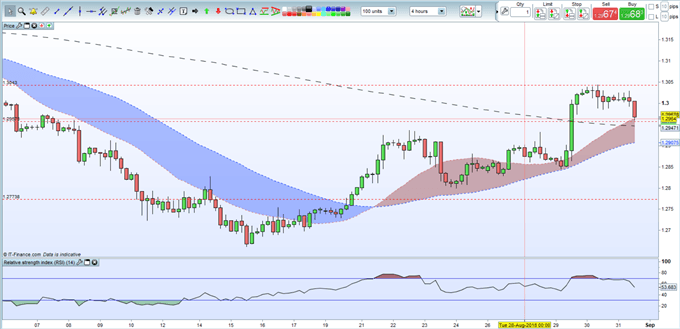
- Four-hour chart is sitting on a cluster of moving averages which may provide upward momentum.
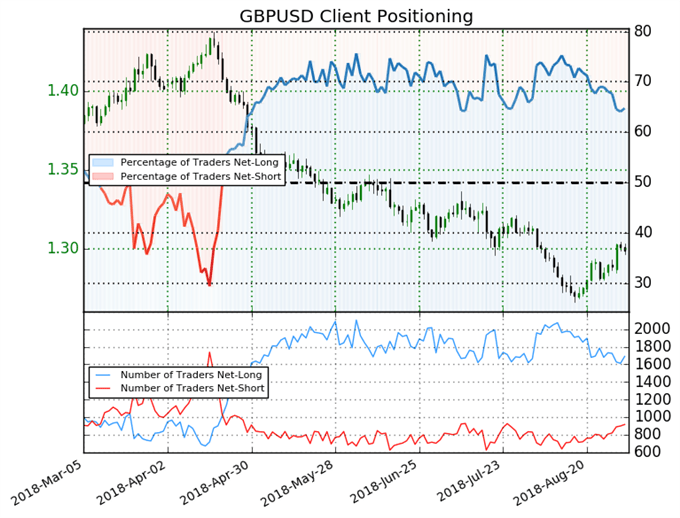
- Retail traders are long, and sentiment remains positive.
GBPUSD retook the 1.3000 ‘headline’ level and has now just faded lower but another, stronger, attempt to turn this into new support looks likely. The pair also sit near the top of 20- and 50-day cloud and need to clear this to push further ahead. The RSI indicator is at a multi-month high, although turning lower, and has plenty of room to push higher before it enters overbought territory. The top of the August 2 ‘bear candle’ at 1.31290 needs to be broken to confirm further strength.
GBPUSD DAILY PRICE CHART (JANUARY – AUGUST 31, 2018)
A look at the four-hour GBPUSD chart also confirms the the pair stuck between 1.2957 and 1.3043 although the downside is being probed. Initial support should be provided by the cluster of moving averages currently between 1.2907 and 1.2963. The short-term uptrend from the August 15 low remains in place and coincides with the bottom of the moving average cluster. Support is likley between 1.2800 and 1.2850 if the lower moving average is broken and closed below.
GBPUSD FOUR-HOUR CHART (AUGUST 6 – AUGUST 31, 2018)
No comments:
Post a Comment